oxyplot的初次使用
oxyplot简介
oxyplot是一个跨平台的作图库,其核心库可以移植到多种平台使用,定制化的控件可以在WPF, Windows 8, Windows Phone, Windows Phone Silverlight, Windows Forms, Silverlight, GTK#, Xwt, Xamarin.iOS, Xamarin.Android, Xamarin.Forms and Xamarin.Mac使用。oxyplot文档目前还在建设,在我使用中没有查阅到有帮助的信息,只能从oxylot的github上clone,然后学习Source/Examples给的实例。
oxplot安装和添加控件
因为oxyplot的文档资源还在建设中,所以并没有给出如何在vstudio的toolbox中添加控件的方法。我又去查阅了其他.net下的graphics库,发现了liveCharts库,其文档资源丰富,照其教程编译了一个example,感觉和winform的画风有差距,更偏向于heml的svg,但是,采用相同方法将oxyplot的control成功添加进了toolbox,猜想此方法具有通用性。
具体的:
1.新建一个项目
2.在解决方案窗口又击引用,选择NuGet(如果vstudio没有自带,需额外安装)
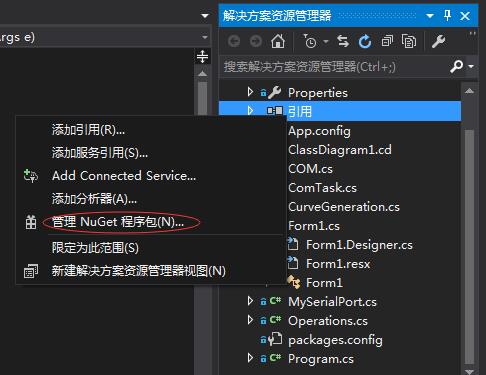

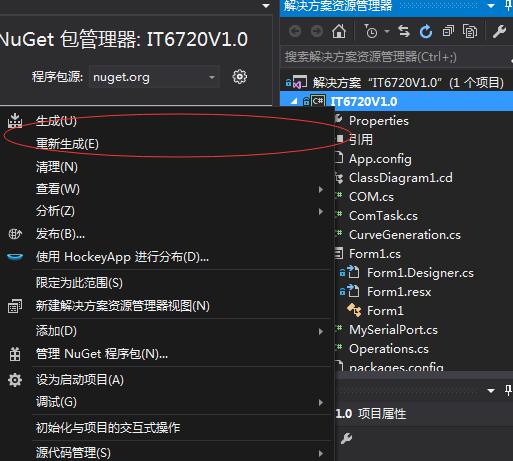
3.在NuGet中搜索oxplot,选择oxyplot.WinForm安装,安装成后,编译生成
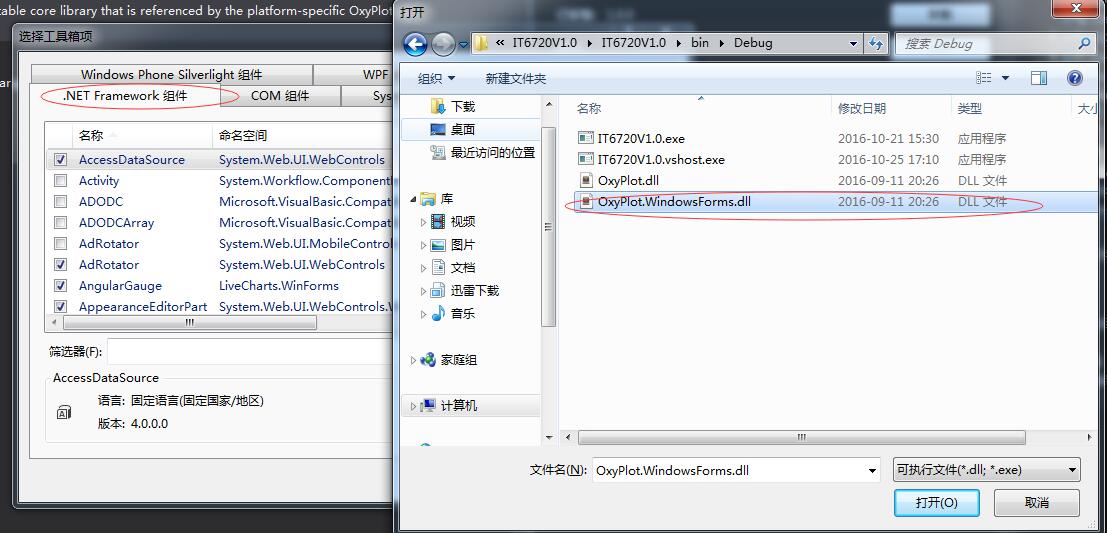
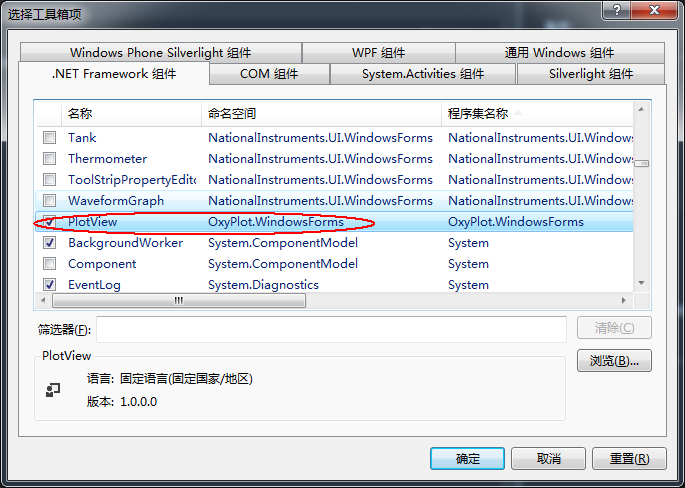
4.调出toolbox工具栏,右击选择其他项,浏览文件夹到debug下,在生成文件文件中添加oxyplot.WinForm.dll,确定后会将oxyplot的plotview控件添加进入工具栏。

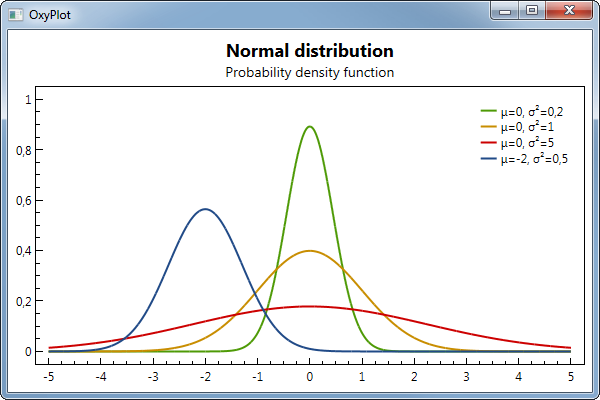
winform简单的示例
根据github上的简单示例:
namespace WindowsFormsDemo
{
    using System;
    using System.Drawing;
    using System.Windows.Forms;

    using OxyPlot;
    using OxyPlot.Series;

    public partial class Form1 : Form
    {
        public Form1()
        {
            InitializeComponent();
            var pm = new PlotModel
            {
                Title = "Trigonometric functions",
                Subtitle = "Example using the FunctionSeries",
                PlotType = PlotType.Cartesian,  // 定义plot类型为笛卡尔坐标系
                Background = OxyColors.White
            };
            pm.Series.Add(new FunctionSeries(Math.Sin, -10, 10, 0.1, "sin(x)")); //在PlotModel中添加数据点,数据点的产生方式为FunctionSerie函数
            pm.Series.Add(new FunctionSeries(Math.Cos, -10, 10, 0.1, "cos(x)"));
            pm.Series.Add(new FunctionSeries(t => 5 * Math.Cos(t), t => 5 * Math.Sin(t), 0, 2 * Math.PI, 0.1, "cos(t),sin(t)"));
            plot1.Model = pm;  //plot1为form中的oxyplot控件plotview的name,将生成的plotModel传递给plotview显示
        }
    }
}
其中,FunctionSeries 根据oxyplot文档解释数据点的产生方式应该是通过String.Format方式,框架作者将其封装好,直接调用,例如我要用的StairStepSeries产生阶梯信号。
使用StairStepSeries产生阶梯曲线
在oxyplot/Source/Examples/ExampleLibrary/Series/StairStepSeriesExamples.cs中给出了StairStepSeries的示例
// --------------------------------------------------------------------------------------------------------------------
// <copyright file="StairStepSeriesExamples.cs" company="OxyPlot">
//   Copyright (c) 2014 OxyPlot contributors
// </copyright>
// <summary>
//   Provides examples for the <see cref="StairStepSeries" />.
// </summary>
// --------------------------------------------------------------------------------------------------------------------

namespace ExampleLibrary
{
    using System;

    using OxyPlot;
    using OxyPlot.Series;

    /// <summary>
    /// Provides examples for the <see cref="StairStepSeries" />.
    /// </summary>
    [Examples("StairStepSeries"), Tags("Series")]
    public static class StairStepSeriesExamples
    {
        [Example("StairStepSeries")]
        public static PlotModel StairStepSeries()
        {
            return CreateExampleModel(new StairStepSeries());
        }

        [Example("StairStepSeries with labels")]
        public static PlotModel StairStepSeriesWithLabels()
        {
            return CreateExampleModel(new StairStepSeries { LabelFormatString = "{1:0.00}" });
        }

        [Example("StairStepSeries with markers")]
        public static PlotModel StairStepSeriesWithMarkers()
        {
            return CreateExampleModel(new StairStepSeries
                         {
                             Color = OxyColors.SkyBlue,
                             MarkerType = MarkerType.Circle,
                             MarkerSize = 6,
                             MarkerStroke = OxyColors.White,
                             MarkerFill = OxyColors.SkyBlue,
                             MarkerStrokeThickness = 1.5
                         });
        }

        [Example("StairStepSeries with thin vertical lines")]
        public static PlotModel StairStepSeriesThinVertical()
        {
            return CreateExampleModel(new StairStepSeries
            {
                StrokeThickness = 3,
                VerticalStrokeThickness = 0.4,
                MarkerType = MarkerType.None
            });
        }

        [Example("StairStepSeries with dashed vertical lines")]
        public static PlotModel StairStepSeriesDashedVertical()
        {
            return CreateExampleModel(new StairStepSeries
            {
                VerticalLineStyle = LineStyle.Dash,
                MarkerType = MarkerType.None
            });
        }

        /// <summary>
        /// Creates an example model and fills the specified series with points.
        /// </summary>
        /// <param name="series">The series.</param>
        /// <returns>A plot model.</returns>
        private static PlotModel CreateExampleModel(DataPointSeries series)
        {
            var model = new PlotModel { Title = "StairStepSeries", LegendSymbolLength = 24 };
            series.Title = "sin(x)";
            for (double x = 0; x < Math.PI * 2; x += 0.5)
            {
                series.Points.Add(new DataPoint(x, Math.Sin(x)));
            }

            model.Series.Add(series);
            return model;
        }
    }
}
重点看到最后CreateExampleModel,其中series其实为
var series = new StairStepseries();
向StairStepseries中添加数据点
series.Points.Add(new DataPoint(x, Math.Sin(x));
最后将添加完成的StairStepseries曲线,添加进PlotModel
plotModel.Series.Add(stairStepseries)
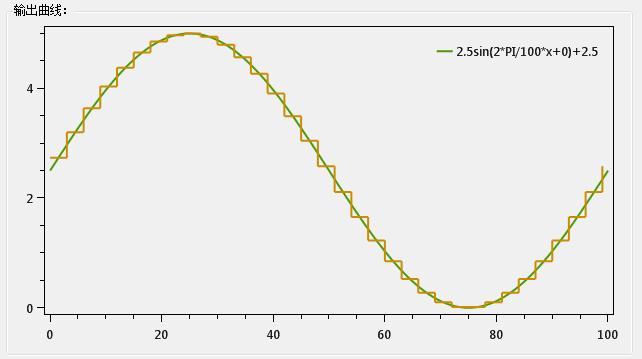
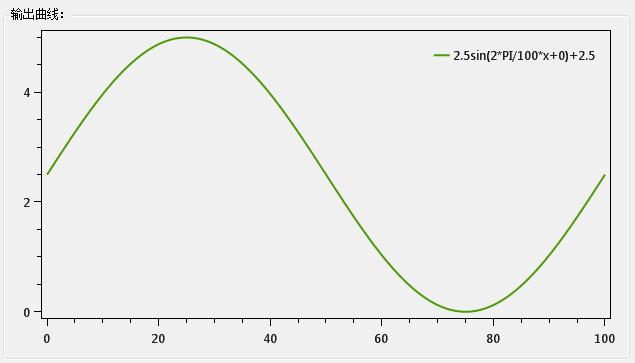
用oxyplot画出的正弦曲线
使用oxyplot的StairStepSeries得到的采样阶梯曲线